How to Read Your Cholesterol Blood Test Results
You just got your lipid panel results. Your doctor glanced at them, said something like “your cholesterol is a little high,” and sent you on your way. Now you're staring at a page full of numbers with no idea what any of them actually mean for you.
This guide walks through every number on a standard cholesterol blood test — what it measures, what the ranges mean, and what actually matters for your cardiovascular risk. By the end, you’ll understand your results better than most people who’ve been managing their cholesterol for years.
What is a lipid panel?
A lipid panel — also called a lipid profile or cholesterol panel — is a blood test that measures the fats circulating in your bloodstream. Most panels require fasting for 9–12 hours beforehand, though non-fasting panels are increasingly common for routine screening.
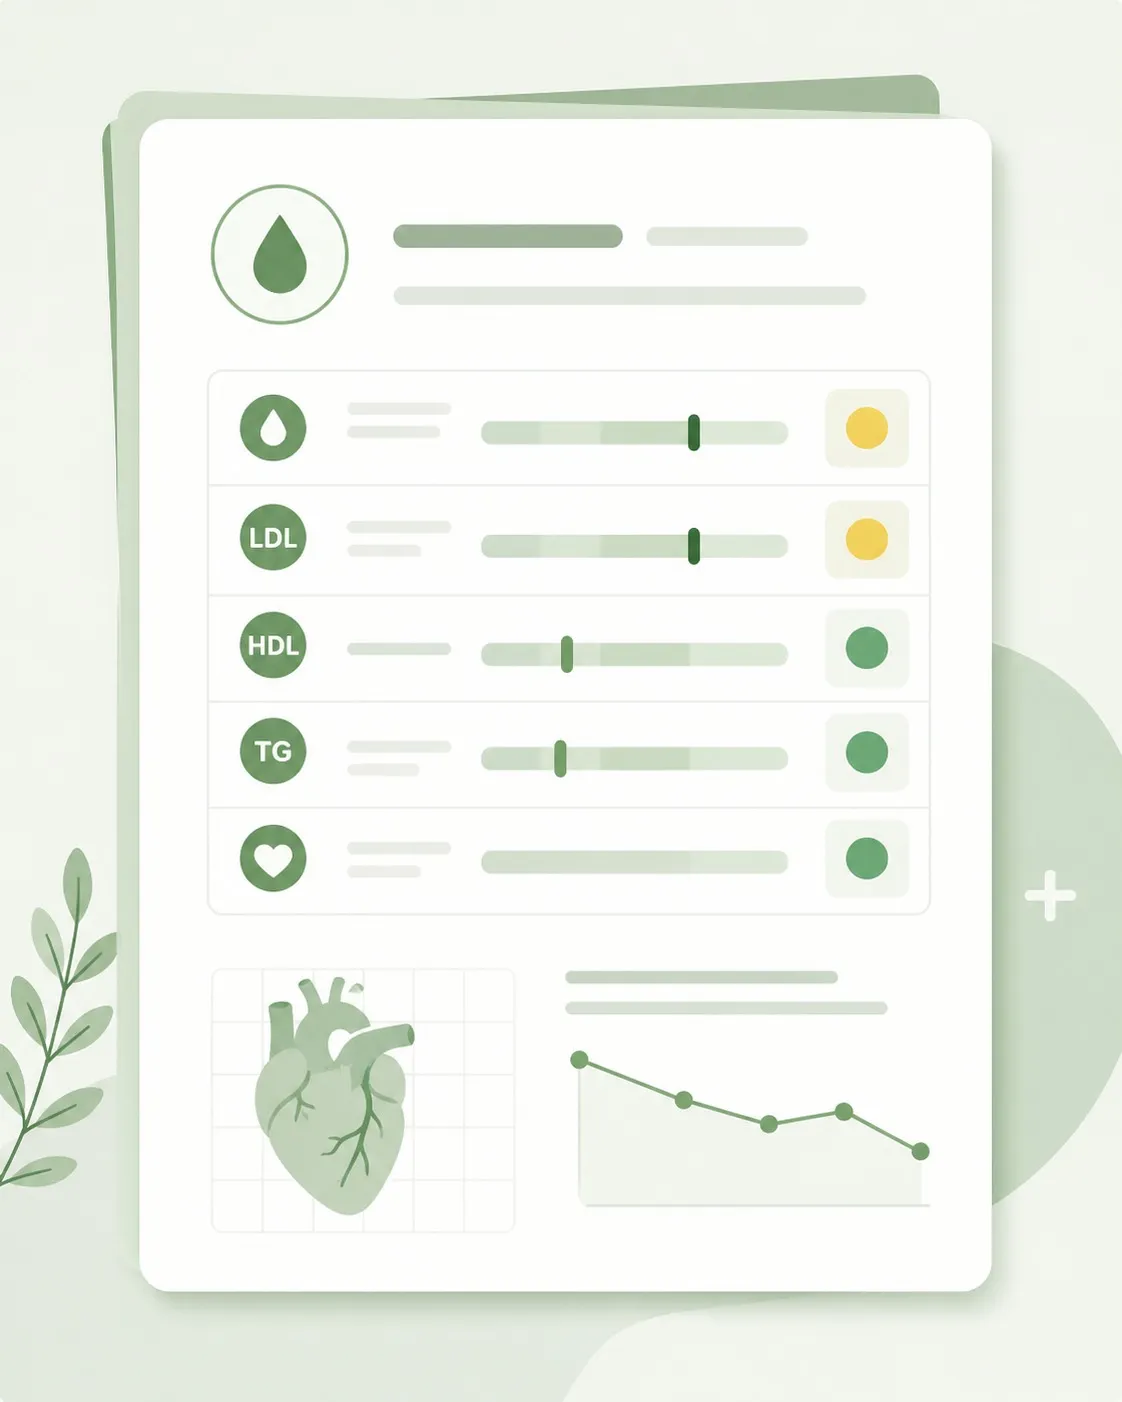
A standard lipid panel measures four things:
- Total cholesterol
- LDL cholesterol (low-density lipoprotein)
- HDL cholesterol (high-density lipoprotein)
- Triglycerides
Some panels also include non-HDL cholesterol, calculated automatically. More advanced panels may include ApoB or Lp(a), though these are rarely ordered as routine.
Total cholesterol — why it matters less than you think
What it is: The sum of all cholesterol in your blood — LDL, HDL, VLDL, and other fractions.
| Result | Category |
|---|---|
| Under 200 mg/dL | Desirable |
| 200–239 mg/dL | Borderline high |
| 240+ mg/dL | High |
What your doctor isn’t telling you: Total cholesterol alone is a poor predictor of cardiovascular risk. HDL cholesterol is protective — it reduces your risk — but it’s included in the total. Someone with total cholesterol of 220 mg/dL could have HDL of 80 mg/dL and LDL of 100 mg/dL — a very favorable profile — while someone with total cholesterol of 190 mg/dL could have HDL of 30 mg/dL and LDL of 140 mg/dL, which is far more concerning.
LDL cholesterol — the number your doctor focuses on most
What it is: LDL particles carry cholesterol from the liver to cells throughout the body. When LDL levels are elevated, cholesterol can accumulate in artery walls, contributing to atherosclerosis — the buildup of plaque that underlies most heart attacks and strokes.
| Result | Category |
|---|---|
| Under 70 mg/dL | Optimal for very high-risk patients |
| Under 100 mg/dL | Optimal for high-risk patients |
| 100–129 mg/dL | Near optimal / above optimal |
| 130–159 mg/dL | Borderline high |
| 160–189 mg/dL | High |
| 190+ mg/dL | Very high |
Important nuance: These are population categories, not personal targets. Your LDL target depends entirely on your overall cardiovascular risk profile. An LDL of 140 mg/dL in a 45-year-old with no risk factors is treated very differently from an LDL of 140 mg/dL in a 65-year-old with diabetes and high blood pressure.
The LDL calculation problem: Most lipid panels don’t actually measure LDL directly. They calculate it using the Friedewald equation:
LDL = Total Cholesterol − HDL − (Triglycerides ÷ 5)
This formula becomes inaccurate when triglycerides are above 400 mg/dL. If your triglycerides are elevated, ask your doctor whether a direct LDL measurement makes sense. The Martin-Hopkins equation is a more accurate alternative now available on some panels.
HDL cholesterol — the number you want higher
What it is: HDL particles transport cholesterol away from artery walls back to the liver for processing and elimination. Higher HDL is generally protective against cardiovascular disease.
| Result | Category |
|---|---|
| Under 40 mg/dL (men) / Under 50 mg/dL (women) | Low — considered a risk factor |
| 40–59 mg/dL | Acceptable |
| 60+ mg/dL | High — considered protective |
What the research shows: A 2012 Mendelian randomization study published in The Lancet found that genetic variants that raise HDL do not necessarily reduce heart attack risk — suggesting that HDL’s protective effect may depend on its function, not just its level.
What raises HDL naturally: Regular moderate-to-vigorous aerobic exercise (most effective), smoking cessation, replacing refined carbohydrates with healthy fats.
Triglycerides — the overlooked number
| Result | Category |
|---|---|
| Under 150 mg/dL | Normal |
| 150–199 mg/dL | Borderline high |
| 200–499 mg/dL | High |
| 500+ mg/dL | Very high — pancreatitis risk |
Triglycerides are highly responsive to dietary changes. The biggest drivers are refined carbohydrates and sugar — not dietary fat. Reducing sugary drinks, white bread, white rice, and alcohol can produce meaningful reductions within weeks.
Non-HDL cholesterol — the underrated marker
What it is: Non-HDL = Total Cholesterol − HDL. It captures all the cholesterol in potentially atherogenic particles: LDL, VLDL, IDL, and Lp(a). Non-HDL is a better predictor of cardiovascular risk than LDL alone in several populations — especially people with elevated triglycerides, diabetes, or obesity. The 2018 ACC/AHA guideline formally recognized non-HDL as a secondary treatment target.
The numbers your panel probably didn’t include — but should
ApoB (Apolipoprotein B)
Every atherogenic particle — every LDL, VLDL, IDL, and Lp(a) particle — carries exactly one ApoB protein. So ApoB gives you a direct count of the number of potentially dangerous particles in your blood. LDL cholesterol tells you how much cholesterol is being carried; ApoB tells you how many carrier particles exist. A 2021 meta-analysis in The Lancet found that ApoB was more strongly associated with cardiovascular events than LDL-C, particularly in people with metabolic syndrome or diabetes.
Lp(a) — Lipoprotein(a)
Lp(a) is a modified LDL particle with an additional protein attached. Elevated Lp(a) is an inherited cardiovascular risk factor that standard lipid panels don’t measure. It affects roughly 1 in 5 people and can significantly increase risk even when LDL appears normal. The 2022 ACC Expert Consensus Decision Pathway recommends measuring Lp(a) at least once in every adult.
How to interpret your results together — not in isolation
Pattern 1: High LDL, normal HDL, normal triglycerides — The classic “isolated high LDL” pattern. Risk depends heavily on your other cardiovascular risk factors.
Pattern 2: Normal LDL, low HDL, high triglycerides — The metabolic syndrome pattern. LDL appears “normal” but the overall risk profile can be significant.
Pattern 3: High LDL with other risk factors — When LDL elevation is accompanied by diabetes, hypertension, smoking, or family history, the threshold for clinical intervention shifts significantly.
Pattern 4: Very high LDL (190+ mg/dL) — The 2026 ACC/AHA guideline recommends clinical evaluation and statin therapy discussion regardless of other risk factors.
Questions worth bringing to your next appointment
- What is my 10-year cardiovascular risk based on all my risk factors?
- Should we measure ApoB and Lp(a) if we haven’t already?
- Given my numbers, what’s the most evidence-supported first step?
- What’s my LDL target given my overall risk profile?
Find out what your numbers mean for you
Your lipid panel gives you data. Our quiz gives you the personalized interpretation — what your specific combination of numbers means for someone your age, with your risk factors, and your treatment preferences.
Take the 2-minute quiz → Free · No account required · Based on 2026 clinical guidelinesSources
- Grundy SM, et al. 2018 AHA/ACC Guideline on the Management of Blood Cholesterol. JACC. 2019;73(24):e285-e350. PMID: 30423393
- Voight BF, et al. Plasma HDL cholesterol and risk of myocardial infarction: a mendelian randomisation study. Lancet. 2012;380(9841):572-580. PMID: 22607825
- Marston NA, et al. Association Between Apolipoprotein B and Cardiovascular Disease. Lancet. 2021. PMID: 33444233
- Lloyd-Jones DM, et al. 2022 ACC Expert Consensus on Nonstatin Therapies for LDL-C Lowering. JACC. 2022;80(14):1366-1418. PMID: 36031461
- Martin SS, et al. Friedewald-estimated versus directly measured LDL cholesterol. JACC. 2013;62(8):732-739. PMID: 23770179
- Santos FL, et al. Meta-analysis of low carbohydrate diets on cardiovascular risk factors. Obes Rev. 2012;13(11):1048-1066. PMID: 22905670